
Horizontal analysis, also known as trend analysis, is used to spot financial trends over a specific number of accounting periods. Horizontal analysis can be used with an income statement or a balance sheet.
At least two accounting periods are required for a valid comparison, though in order to spot actual trends, it’s better to include three or more accounting periods when calculating horizontal analysis.
How detailed your initial financial statements are depends largely on the accounting software application you’re using. If you’re using an entry-level application, it’s likely you’ll need to use spreadsheets in order to complete the horizontal analysis.
Overview: What is horizontal analysis?
Horizontal, or trend, analysis is used to spot and evaluate trends over a specific period of time.
For instance, instead of creating a balance sheet or income statement for one specific period of time, you would also create a comparative income statement or balance sheet that covers quarterly or annual activity for your business.
The comparative statement is then used to highlight any increases or decreases over that specific time frame. This enables you to easily spot growth trends as well as any red flags that may need to be addressed.
Horizontal analysis uses a line-by-line comparison to compare the totals. For example, if you run a comparative income statement for 2018 and 2019, horizontal analysis allows you to compare revenue totals for both years to see if it increased, decreased, or remained relatively stagnant.
Adding a third year to the analysis will be even more helpful, as you’ll be able to see if there is a definite trend.
Horizontal analysis vs. vertical analysis: What’s the difference?
Horizontal analysis looks at changes line by line between specific accounting periods, usually quarterly or yearly, whereas vertical analysis restates balance sheet or income statement amounts as a percentage of total assets (balance sheet) or net sales (income statement).
While horizontal analysis is used to compare line items over specific periods of time in order to spot trends, vertical analysis is used to restate and compare changes in percentages, and is more frequently used by investors and creditors to compare company performance with other companies in the same industry.
How to perform a horizontal analysis
Use the following steps to begin performing a horizontal analysis:
Step 1: Run a comparative income statement and balance sheet for the periods you wish to compare. You’ll need a minimum of two periods to compare, but you’ll be able to spot trends much better if you use at least three periods.
Step 2: Decide how you want to approach your horizontal analysis. You have several options:
• Direct comparison: The direct comparison is simply comparing the results of one accounting period to another. For example, if your 2018 revenue was $20,000 and your 2019 revenue was $27,000, the difference would be $7,000. The comparison method allows you to quickly view any changes from period to period, and whether those changes are beneficial or require further research.
• Variance: You can choose to calculate the variance between your chosen periods to determine whether the impact was positive or negative. The variance method is particularly helpful when the horizontal analysis is being used to determine the financial health of your business by those outside the business, such as investors and creditors.
• Percentage: The percentage method is helpful if you’re looking for more in-depth analysis. Using the percentage method, the first period of your income statement or balance sheet is considered your base period, with each subsequent period comparing line-by-line results to the base year. For example, in the income statement below, the difference in revenue between 2017 and 2018 is $13,000, so you would use the following horizontal analysis formula to determine the percentage by which revenue increased:
$13,000 ÷ $54,000 x 100 = 24%
That means that from 2017 to 2018, your revenue increased by 24%.
To compare 2019 revenue to 2017 revenue, you’ll complete the following calculations:
$73,000 – $54,000 = $19,000 variance
$19,000 ÷ $54,000 x 100 = 35% increase in revenue
You can also choose to calculate income statement ratios such as gross margin and profit margin.
Horizontal Analysis – Income Statement
| Revenue | $54,000 | $67,000 | $73,000 |
| Cost of goods sold | 22,000 | 29,000 | 31,000 |
| Gross profit | 32,000 | 36,000 | 42,000 |
| Sales and marketing | 1,000 | 2,200 | 3,500 |
| Administrative | 900 | 1,100 | 2,100 |
| Operating Expenses | 30,100 | 32,700 | 36,400 |
| Depreciation | 150 | 550 | 1,250 |
| Operating Income | 29,950 | 32,150 | 35,150 |
| Interest Expense | 500 | 750 | 1,000 |
| Income before taxes | 29,450 | 31,400 | 34,150 |
| Income tax expense | 1,100 | 1,550 | 1,750 |
| Net Income | 28,350 | 29,850 | 32,400 |
Step 3: Review your results. The quickest way to spot trends is to view the changes from period to period, but for more substantial analysis, you’ll want to view variances, either as dollar amounts or percentages.
If you’d rather see both variances and percentages, you can add columns in order to display changes in both. While this format takes the most time to create, it also makes it easier to spot trends and better analyze business performance. This method works best when you’re comparing two years side by side.
Horizontal Analysis – Income Statement
| Revenue | $54,000 | $67,000 | $13,000 | 24% |
| Cost of goods sold | 22,000 | 29,000 | 7,000 | 32% |
| Gross profit | 32,000 | 36,000 | 4,000 | 12.5% |
| Sales and marketing | 1,000 | 2,200 | 1,200 | 120% |
| Administrative | 900 | 1,100 | 200 | 22% |
| Operating Expenses | 30,100 | 32,700 | 2,600 | 8.6% |
| Depreciation | 150 | 550 | 400 | 266% |
| Operating Income | 29,950 | 32,150 | 2,200 | 7.4% |
| Interest Expense | 500 | 750 | 250 | 50% |
| Income before taxes | 29,450 | 31,400 | 1,950 | 6.6% |
| Income tax expense | 1,100 | 1,550 | 450 | 41% |
| Net Income | 28,350 | 29,850 | 1,500 | 5.3% |
Using the comparative income statement above, you can see that your net income changed by $1,500 from 2017; a percentage increase of 5.3%, but what really stands out on the income statement is the 266% increase in depreciation expense.
If you purchased several fixed assets during 2018, the increase is easily explained, but if you didn’t, this would need to be researched.
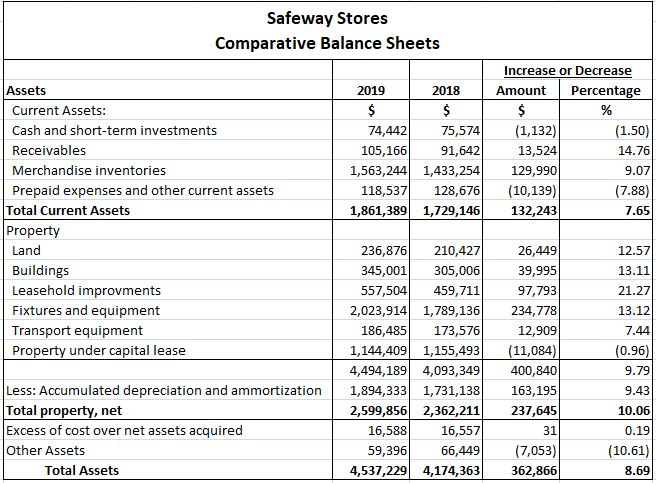
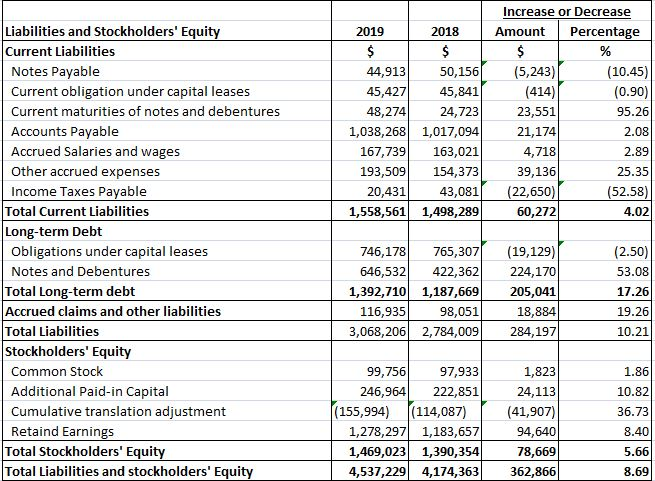
Calculating the horizontal analysis of a balance sheet is a similar process. You can choose to run a comparative balance sheet for the periods desired, or complete a side-by-side comparison of two years.
The example from Safeway Stores shows a comparative balance sheet for 2018 and 2019 following a similar format to the income statement above.
Horizontal analysis helps you spot trends
While financial statements are essential for managing your business, an income statement or balance sheet for a single period of time will not tell the complete story. Horizontal analysis answers a lot of questions, including:
• How much has my revenue increased in the last quarter/year?
• Is my cost of goods sold going up or down?
• What areas of my business have seen the most changes?
• Is my net income increasing or decreasing?
There’s a reason horizontal analysis is often referred to as trend analysis. Looking at and comparing the financial performance of your business from period to period can help you spot positive trends, such as an increase in sales, as well as red flags that need to be addressed.
Whether you do a horizontal analysis quarterly or yearly, it’s worth the time and effort to perform this calculation regularly.
The post Horizontal Analysis: Should You Be Using It in Your Business? appeared first on The blueprint and is written by Mary Girsch-Bock
Original source: The blueprint